

Investigation of an Arrhenius relationship#
In addition to being able to determine the mean-squared displacement and diffusion coefficient from a given simulation, kinisi also includes tools to investigate Arrhenius relationships. In this tutorial, we will look at how we can take advantage of these tools to study short, approximately 50 ps, simulations of lithium lanthanum zirconium oxide (LLZO).
Warning
The warnings that are being ignored are related to the parsing of the files by MDAnalysis and lead to unnecessary print out to the screen that we want to avoid in the web documentation.
[1]:
# This initialises the duecredit framework
%env DUECREDIT_ENABLE=yes
%env DUECREDIT_FILE=arrhenius.duecredit.p
import duecredit
duecredit.due.activate()

import numpy as np
import scipp as sc
import MDAnalysis as mda
import matplotlib.pyplot as plt
from kinisi.analyze import DiffusionAnalyzer
from kinisi.arrhenius import Arrhenius
from scipy.stats import uniform
import warnings
np.random.seed(42)
warnings.filterwarnings("ignore", category=UserWarning)
warnings.filterwarnings("ignore", category=RuntimeWarning)
env: DUECREDIT_ENABLE=yes
env: DUECREDIT_FILE=arrhenius.duecredit.p
/opt/hostedtoolcache/Python/3.12.15/x64/lib/python3.12/site-packages/duecredit/injections/injector.py:340: TqdmWarning: IProgress not found. Please update jupyter and ipywidgets. See https://ipywidgets.readthedocs.io/en/stable/user_install.html
  mod = self._orig_import(name, *args, **kwargs)
To investigate this we will loop through a series of four temperatures and store each mean and variance of the diffusion coefficient in a dictionary.
[2]:
temperatures = np.array([500, 600, 700, 800])
D = {'mean': [], 'var': []}
To read these simulations we will use MDAnalysis (however, it is also possible to use any kinisi.Parser). The parameters are defined for all simulations, here we only consider the diffusive regime to begin after 10 ps.
[3]:
params = {'specie': 'LI',
            'time_step': 5.079648e-4 * sc.Unit('ps'),
            'step_skip': 100 * sc.units.dimensionless,
            'progress': False}
File parsing and diffusion determination is then performed in a loop here.
[4]:
for t in temperatures:
    u = mda.Universe(f'_static/traj_{t}.gro', f'_static/traj_{t}.xtc')
    d = DiffusionAnalyzer.from_universe(u, **params)
    d.diffusion(10 * sc.Unit('ps'), progress=False)
    D['mean'].append(sc.mean(d.D).value)
    D['var'].append(sc.var(d.D, ddof=1).value)
    unit = sc.mean(d.D).unit
We can then use the diffusion coefficients and their variances can be used along with the array of temperatures to create a scipp.DataArray.
[5]:
td = sc.DataArray(
    data=sc.array(dims=['temperature'],
                  values=D['mean'],
                  variances=D['var'],
                  unit=unit,),
    coords={
        'temperature': sc.Variable(dims=['temperature'],
                                   values=temperatures,
                                   unit='K')
    })
td
[5]:
- temperature: 4
- temperature(temperature)int64K500, 600, 700, 800
Values:
array([500, 600, 700, 800])
- (temperature)float64cm^2/s3.438e-06, 5.047e-06, 6.932e-06, 1.023e-05σ = 1.923e-07, 2.609e-07, 3.334e-07, 4.306e-07
Values:
array([3.43759078e-06, 5.04685563e-06, 6.93231134e-06, 1.02284400e-05])

Variances (σ²):
array([3.69712834e-14, 6.80874148e-14, 1.11142910e-13, 1.85411254e-13])
With the DataArray created, we can now create the Arrhenius object.
[6]:
priors = [uniform(0.1, 0.1), uniform(1e-5, 9e-5)]

s = Arrhenius(td, priors=priors)
When you create a TemperatureDependent object, of which Arrhenius is a subclass, you can optionally provide priors as a list of scipy.stats objects. For example, if we wanted the activation energy to be restricted between 0.1 and 0.2 eV and the preexponential factor between 10-5 and 10-4 cm2/s, then we would use the following:
priors = [uniform(0.1, 0.1), uniform(1e-5, 9e-5)]

s = Arrhenius(td, priors=priors)
uniform is loc (the minimum), and the second is scale (the width, i.e., max - min).scipy.stats documentation to clarify how to use these objects. If you do not set priors, they are automatically set to be uniform with a min and max of 0.5 and 1.5 times the maximum-likelihood values.The Arrhenius object automatically estimates the maximum-likelihood values for the activation energy and preexponential factor and stores them in an appropriate sc.DataGroup.
[7]:
s
[7]:
- datascippDataArray(temperature: 4)float64cm^2/s3.438e-06, 5.047e-06, 6.932e-06, 1.023e-05
- activation_energyscippVariable()float64eV0.15000000000000002
- preexponential_factorscippVariable()float64cm^2/s5.5e-05
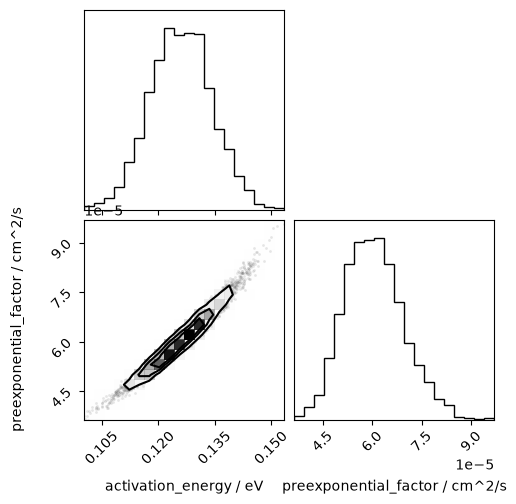
However, kinisi also allows us to estimate the full distribution of these parameters with Markov chain Monte Carlo (MCMC) sampling.
[8]:
s.mcmc()
MCMC Sampling: 100%|██████████| 1500/1500 [00:09<00:00, 158.81it/s]
We can then visualise the probability distributions for the parameters as histograms.
[9]:
from corner import corner
[10]:
corner(np.array([i.values for i in s.flatchain.values()]).T,
       labels=[' / '.join([k, str(v.unit)]) for k, v in s.flatchain.items()])
plt.show()
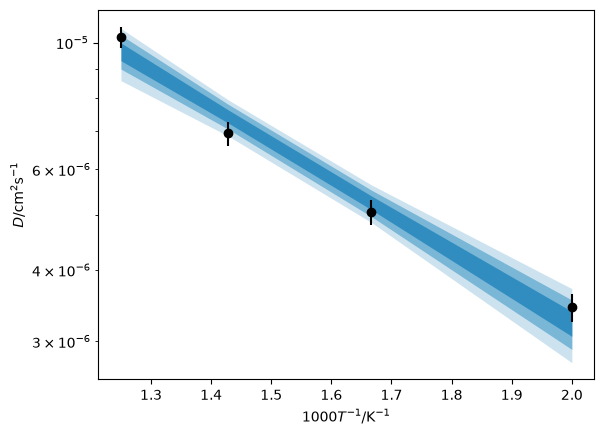
It is also possible to plot these probability distributions as Arrhenius relations on the data measured values.
[11]:
credible_intervals = [[16, 84], [2.5, 97.5], [0.15, 99.85]]
alpha = [0.6, 0.4, 0.2]

plt.errorbar(1000/td.coords['temperature'].values,
             td.data.values,
             np.sqrt(td.data.variances),
             marker='o',
             ls='',
             color='k',
             zorder=10)

for i, ci in enumerate(credible_intervals):
    plt.fill_between(1000/td.coords['temperature'].values,
                     *np.percentile(s.distribution, ci, axis=1),
                     alpha=alpha[i],
                     color='#0173B2',
                     lw=0)
plt.yscale('log')
plt.xlabel('$1000T^{-1}$/K$^{-1}$')
plt.ylabel('$D$/cm$^2$s$^{-1}$')
plt.show()
Finally, the activation energy and preexponential factor are kinisi.samples.Samples objects and are stored in the Arrhenius object.
[12]:
s.activation_energy
[12]:
- (samples: 3200)float64eV0.126+/-0.008
Values:
array([0.12300125, 0.13390652, 0.13116524, ..., 0.11910219, 0.10970325,
       0.12208914], shape=(3200,))
[13]:
s.preexponential_factor
[13]:
- (samples: 3200)float64cm^2/s(6.1+/-0.9)e-05
Values:
array([5.75811126e-05, 7.02530296e-05, 6.60191510e-05, ...,
       5.44108739e-05, 4.47515775e-05, 5.57048762e-05], shape=(3200,))
[14]:
from duecredit import due

due.dump()
DueCredit Report:
- Molecular simulation analysis library / MDAnalysis (v 2.11.0) [1, 2]
- kinisi: Bayesian analysis of mass transport from molecular dynamics simulations / kinisi (v 2.1.0) [3]
  - Enables MCMC and nested sampling of temperature-dependent behaviour. / kinisi.arrhenius.TemperatureDependent (v 2.1.0) [4]
  - Performs the Bayesian regression approach. / kinisi.diffusion.Diffusion.bayesian_regression (v 2.1.0) [5]
  - Implements the minimum eigenvalue method for matrix reconditioning. / kinisi.diffusion.minimum_eigenvalue_method (v 2.1.0) [6]
  - Uses the TOR scheme to find the unwrapped displacements of the atoms in the trajectory. / kinisi.parser.Parser.orthorhombic_calculate_displacements (v 2.1.0) [7]
- Scientific tools library / numpy (v 2.5.4) [8]

3 packages cited
4 modules cited
0 functions cited

References
----------

[1] Gowers, R. et al., 2016. MDAnalysis: A Python Package for the Rapid Analysis of Molecular Dynamics Simulations. In Proceedings of the 15th Python in Science Conference. SciPy.  SciPy, pp. 98–105.
[2] Michaud‐Agrawal, N. et al., 2011. MDAnalysis: A toolkit for the analysis of molecular dynamics simulations. Journal of Computational Chemistry, 32(10), pp.2319–2327.
[3] McCluskey, A.R. et al., 2024. kinisi: Bayesian analysis of mass transport from molecular dynamics simulations. Journal of Open Source Software, 9(94), p.5984.
[4] McCluskey, A.R., Coles, S.W. & Morgan, B.J., 2026. Bayesian Methods for the Investigation of Temperature Dependence in Conductivity. PRX Energy, 5(2).
[5] McCluskey, A.R., Coles, S.W. & Morgan, B.J., 2024. Accurate Estimation of Diffusion Coefficients and their Uncertainties from Computer Simulation. Journal of Chemical Theory and Computation, 21(1), pp.79–87.
[6] Tabeart, J.M. et al., 2020. Improving the condition number of estimated covariance matrices. Tellus A: Dynamic Meteorology and Oceanography, 72(1), p.1696646.
[7] Bullerjahn, J.T. et al., 2023. Unwrapping NPT Simulations to Calculate Diffusion Coefficients. Journal of Chemical Theory and Computation, 19(11), pp.3406–3417.
[8] Van Der Walt, S., Colbert, S.C. & Varoquaux, G., 2011. The NumPy array: a structure for efficient numerical computation. Computing in Science & Engineering, 13(2), pp.22–30.